Most clubs assess the performance of their teams by referring to scoreboard journalism. This could give a distorted image, knowing that football results don’t always display a team’s true performance. In this respect, the use of match data could be a good alternative to capture performance trends, as it takes into account the low-scoring nature of the game.
For example, the graph below follows this approach by depicting (1) the actual goal difference per game and (2) the expected goal (xG) difference per game. The difference between these two indicators, is that the actual goal difference is heavily influenced by random game events and doesn’t fully captures the game’s story. This in contrast to the expected goal difference, which is more objective, being based on the number of chances created and given away.
Looking at the graph, the beauty of the underlying blue trend line is that it gives the following insights:
- Teams above the trend line are outperforming on what we could expect looking at their match performances. Probably, these teams won’t continue to have these positive goal differences in matches unless their underlying performances change for the better;
- Conversely, teams below the trend line are expected to do better, as their underlying performances in terms of creating –and preventing chances, deserve better.
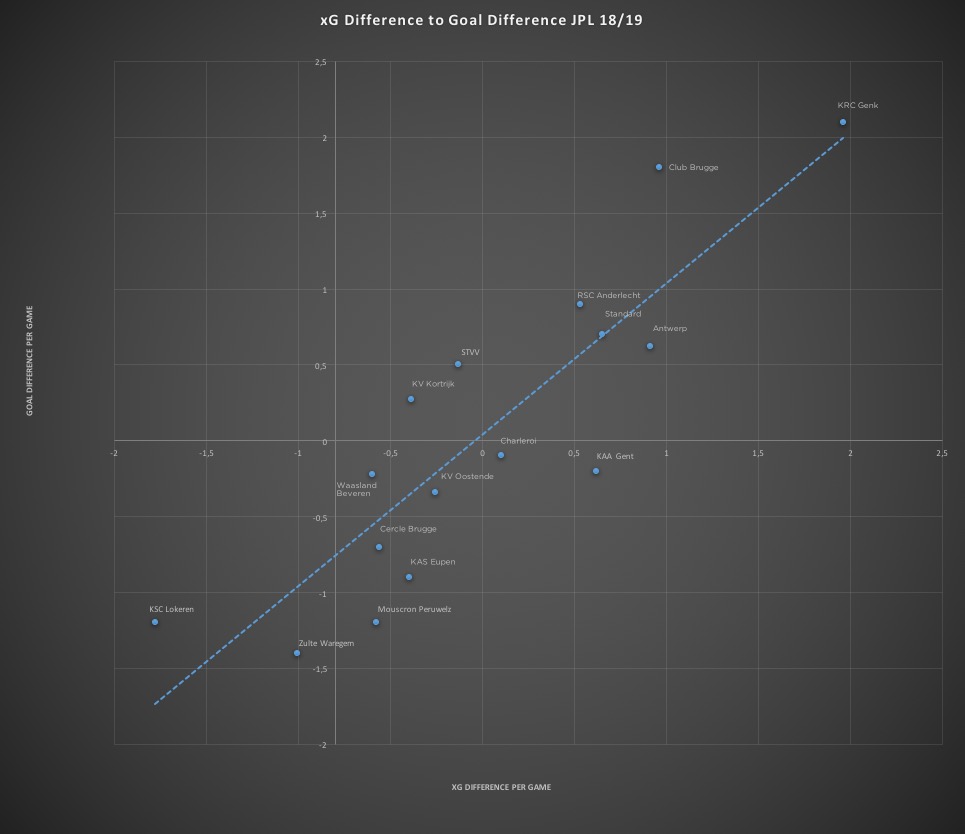
From this graph, the following three observations stand out:
- The race for the title
Is Genk heading towards their 4th title? The data says yes! First of all, Genk has the highest expected goal difference of all teams in the Jupiler Pro League. Secondly, they are just above the trend line and are thus performing at the level we could expect from their underlying game data. This in contrast to their main competitor Club Brugge who is outperforming. Hence, Club Brugge is expected to experience a (small) setback, when they don’t start to perform better. - The battle to stay in the first division
With respect to relegation, the data shows Lokeren should be worried, being far above the trend line. In addition to that their expected goal difference is the lowest of all teams in the Jupiler Pro League. This in contrast, to Zulte Waregem and Mouscron who had some bad luck and are expecting to perform better based on their inherent match performances in case they continue like this. - Data and the dismissal of Yves Vanderhaeghe
The case of KAA Gent: Does changing the coach improve a team’s results? Looking at the data, KAA Gent has been the biggest underperformer, based on what we could expect from their underlying match data (expected goal difference). Should KAA Gent have given Vanderhaeghe therefore more credit? And what if KAA Gent starts to perform better under their new coach Thorup? Is it then the result of the new coach or Gent’s luck which is turning? - Conclusion
Obviously, football has a lot of randomness, something which cannot be fully covered by data of 10 games. Things could always change, as 10 games in itself isn’t a big enough sample to shake all the luck out.
Nevertheless, the above graph gives an indication of where the season is heading. Stirr will keep you posted with updates whether this eventually checks out.